Beware the Ides of March
“You take on what’s right in front of you. You want to do the best you can with the opportunities that you have.”
– Don Shula
Ides of March is the 74th day in the Roman calendar, corresponding to 15 March. It was marked by several religious observances and was a deadline for settling debts in Rome. In 44 BC, it became notorious as the date of the assassination of Julius Caesar, which made the Ides of March a turning point in Roman history.1
At the risk of being hyperbolic, we posit that the failure of Silicon Valley Bank in early March may also be a turning point in this Federal Reserve’s (Fed) rate cycle. Shortly before the deposit run on SVB, the Fed had strongly intimated that it would consider raising its discount rate by 50 basis points at its March meeting in order to fight inflation. Concerns over how many other domestic banks may have mismanaged their bond portfolio’s interest rate risk, and how they might be vulnerable to deposit runs, led the Fed to raise rates by only 25 basis points on March 23rd to a range of 4.75-5%. The Fed’s next meeting is in mid-May, and they are currently expected to raise rates by 0.25% again and perhaps pause rate actions for some time as they monitor the lagged effects on the economy from raising rates five percent (from zero) in just 12 months. Many market observers have increased the probability of a recession over the next six to twelve months as banks tighten credit standards to minimize future loan losses.
Investment markets reflected several crosscurrents in the quarter ended 3/31/2023. Concerned over banks’ unrealized bond losses (bond prices drop as rates rise), investors sold financial stocks and bought technology and other growth stocks. They also pulled money out of smaller banks and bought money market funds. Growth stocks were buoyed by expectations that interest rates may be close to peaking and by optimistic expectations around AI (artificial intelligence) applications. Bond markets all but ignored Fed pronouncements, pricing in interest rate decreases for later this year despite the Fed stating that rate decreases are not in their base case for 2023. When the dust settled, markets had a volatile but constructive quarter with gains across most asset classes.
Table One: Capital Markets First Quarter 2023
| S&P 500 Total Return Index | 7.0% |
| NASDAQ | 16.8% |
| Euro Stoxx50 | 15.5% |
| NIKKEI (Japan) | 6.0% |
| CSI 300 (Shanghai) | 4.9% |
| Bloomberg U.S. Agg (bonds) | 3.0% |
| Crude Oil Futures | -1.8% |
| Gold Futures | 8.0% |
Source: RWM, Bloomberg L.P.
The rebound in tech stocks allowed the NASDAQ to outpace other indices. International developed markets continued their strong performance vs. U.S. stocks. Bond yields were highly volatile, but the Bloomberg U.S. Aggregate Bond Index rose 3%. Uncertainty and modest dollar weakness help boost gold 8%. Crude Oil futures dropped almost 2% leading oil consortium, OPEC+ to announce a 1% supply cut to shore up oil prices in early April.
Valuation
Although stock markets are cheaper, they are still not “cheap” as index valuations are near historical averages. U.S. stocks (as measured by the S&P 500) are trading at average prices of 18.5 times trailing earnings and 17 times forward earnings as investors look through the near-term slowdown into recovery years.
Figure One: Leading European stock values are still lagging U.S. averages.
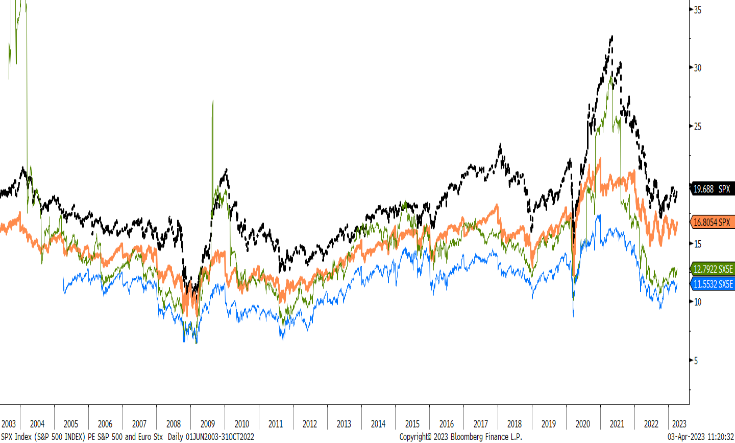
As reflected in Figure One, the SX5E Index2 representing leading Euro stocks is trading at a 13 times price to their last twelve-month earnings, about one-third cheaper than the S&P500’s.
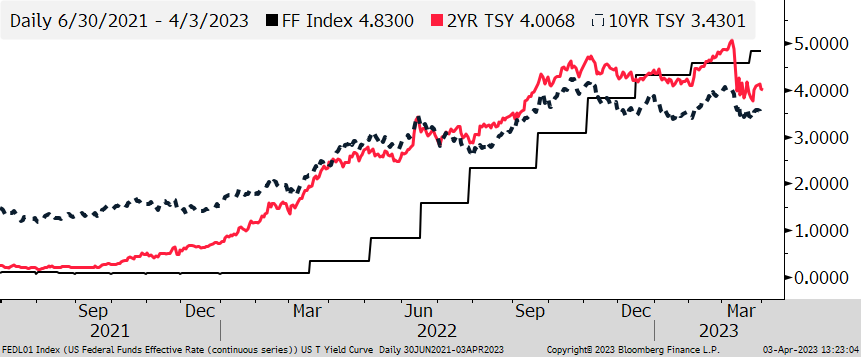
Bond investors expect the FED to lower rates in late 2023 as the economy slows as reflected by an inverted yield curve between the two-year note and the ten-year Treasury bond yields. As seen in Figure Two, yield curves collapsed in March as banking and recession fears escalated. The drop in two-year Treasury yields (red line) is a sharp contrast to the still rising Fed Funds rate.
Figure Two: Treasury Yields vs. Fed Funds rate.
Investment Strategy
We maintain our diversified allocation to stocks with a healthy sub-allocation to international developed markets. Our QUAD (quality at a discount) stocks represent about half of our U.S. equities exposure. Bond allocations still reflect less interest rate sensitivity than the relevant index, but we have modestly increased duration in March. While we anticipate adding to duration later this year, we currently view the bond rally as overdone and expect yields to rise in the near term. Our “mini-ladder” in bond portfolios, short-term U.S. Treasuries maturing every three months into mid-2024, allow clients to earn about 4.6% per annum over the next 18 months with no loss potential if held to maturity.
Outlook
A slower economy may well impact small businesses more than larger, publicly traded companies that have superior liquidity and ample access to capital markets. But as unemployment rises, consumer spending will decline and many of the largest firms will see lower revenues. The recent bank run risk appears to be limited to the two failed banks3 and possibly several much smaller banks that have weak liquidity and bond investment profiles. Ironically, the late March rally in Treasury bond prices reduces possible investment portfolio losses at 3/31/2023. The FDIC guaranteed all depositors at the two failed institutions to help stem the runs. They may not extend insurance coverage to uninsured depositors of future failed banks (above the $250,000 FDIC limit per account) rendering them vulnerable to losing some money. Call us if you have any questions in this regard.
May we all do the best we can with the opportunities that we have. Thank you for allowing us to be on your financial team and for referring us to those you care about most.

Click here to download printable version of this newsletter.
1 Wikipedia
2 SX5E Index – Europe’s leading blue-chip index for the Eurozone, provides a blue-chip representation of super-sector leaders in the region. The index covers 50 stocks from 11 Eurozone countries.
3 Silicon Valley Bank, Signature Bank both failed in March
Regency Wealth Management is a SEC Registered Investment Advisor managing over $600 million for families and small institutional investors. Regency was founded in 2004, is headquartered in New Jersey, and serves clients across the country.