Bubbles
“Some things have to be believed to be seen.”
– Ralph Hodgson
Bubbles. Not soap or bubble bath ones but speculative ones. Investopedia describes them as a spike in asset values caused by exaggerated expectations of the future – the bubble subsequently bursts and prices fall to a much lower and more reasonable level. One possible bubble in the making is Bitcoin and other “virtual currencies”. These “assets” have no central issuing authority, are decentralized, and math based assets transacted cryptographically. Traditional currency is a generally accepted form of money issued by governments, circulated widely, and used as a way to exchange for goods and services [1]. Traditional currencies are also viewed as a store of value. In contrast, Bitcoin (and other cryptocurrency) has limited circulation, trans-actionality, and historical evidence of value. Bitcoin has also exhibited high volatility surging from $1,000 to over $19,000 before pulling back in late December.
Figure One: Bitcoin
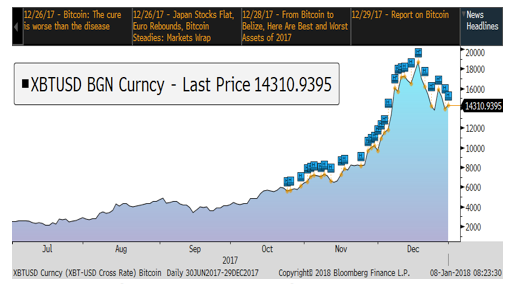
While we have no clue how far and long it will climb, it looks like a bubble in the making and bubbles often end in tears. We are not tempted to place a bit of our clients’ hard-earned coin into it.
Stocks post new highs, bond yields rise
More traditional investments are doing just fine, thank you. The U.S. stock market is up over 300% since its low of early March, 2009. For all of 2017, the S&P 500 Index rose 19% and its total return was 22% (reflecting reinvestment of dividends). Is this a “bubble” about to burst? Is it rational optimism backed up by fundamentals? How long will this rise last?
Figure Two: Major Global Stock Indices 2017
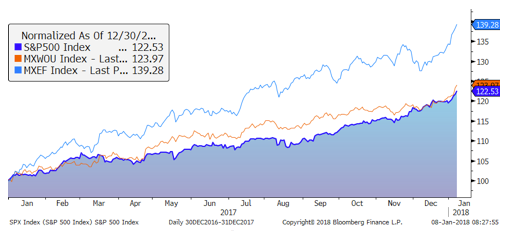
All three global market indices charted in Figure Two (S&P 500, MSCI Developed and MSCI Emerging Markets) rose smartly this year. For all of 2017, U.S. stocks, as measured by the S&P 500 index, rose every month save for March when it dropped a whopping 0.04%. Congress approved a major tax bill and the President signed it into law the week before Christmas. Lower corporate taxes and simpler deductibility rules for individuals were warmly greeted by the stock market. Bond markets responded in Grinch-like fashion selling off.
We may be overdue for a pull back but we enter 2018 with momentum following a fourth quarter return exceeding 6%. Oil prices rebounded to close 2017 near $60/barrel, up from $51.70 at 9/30/2017). Gold prices ended at $1,287/oz.
The U.S. bond market, as measured by the Bloomberg Barclays U.S. Aggregate Bond Index, rose 3.5% in 2017 but limped into 2018 up 0.38% in the fourth quarter. It yields an uninspiring 2.78% and has a duration (a measure of interest rate sensitivity) exceeding six years. Should interest rate increase 1% in 2018, this index would lose about 2.5%. More importantly, the yield curve flattened in 2017 as shown below:
Figure Three: Treasury yield spreads are flattening
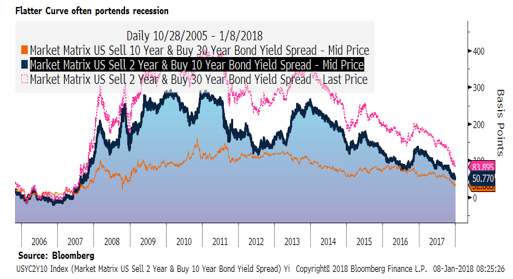
Historically, when the difference in yield between the two-year and ten-year Treasury note is below 75 basis points (spread), trouble is not far behind. Roughly two-thirds of the time this leads to a flat to inverted spread with a recession occurring within two years. The U.S. ten treasury yield ended the year at 2.41% after the Federal Reserve, as expected, increased the targeted discount rate by 0.25% to 1.25-1.5%. It anticipates raising the rate another 0.75% in 2018. Global bond yields, while still low, rose modestly as investors have started to discount less accommodative monetary policies in 2018. The challenge to Central Bankers is to reduce the extraordinary amounts of liquidity injected into the bond and lending markets without derailing nascent economic recoveries.
Economic and Capital Market Fundamentals
U.S. third quarter 2017 economic growth replicated the second quarter’s 3%+ rate reflecting healthy consumer consumption. Unemployment dropped to a 4.1% rate, the lowest in 16 years and below the Federal Reserve Bank’s estimate of full employment. Average home prices accelerated 6%+ year-over-year. European and Japanese economic growth is trending at 2%+ contributing to an evolving synchronized global expansion. U.S. equity valuations are not visibly cheap but remain very competitive relative to bonds. On the margin, we have generally increased our allocations to international developed stocks as they appear to be less pricey. While we have reduced our clients’ portfolio risk profiles to reflect higher stock valuations and low interest rates, we do not view stocks as overvalued.
Outlook
We mentioned last quarter that significantly higher stock market returns over the next few years will likely require higher earnings and faster economic growth. Near term prospects seem good for earnings growth. Lower corporate taxes and a tax holiday enabling U.S. companies to bring overseas cash home may prompt higher dividends, stock buybacks, acquisition, and/or higher capital spending. The extent of economic expansion along with investor sentiment will be key to further stock gains. Longer term, higher deficit spending may well carry negative consequences. We remain vigilant as to possible bubbles forming.
Thank you for your continued trust in your Regency team. We are blessed to partner with you as we navigate ever changing investment trends and align them with your long term financial goals.
Please call us to share any thoughts, concerns, or insights!
Andrew M. Aran, CFA
Mark D. Reitsma, CFP®, CMFC
Timothy G. Parker, CFA
Bryan D. Kabot, CFP®, AAMS®
[1] Investopedia
Fill in your name and e-mail to download a newsletter PDF. (4th Quarter 2017)
Regency Wealth Management is a SEC Registered Investment Advisor managing over $600 million for families and small institutional investors. Regency was founded in 2004, is headquartered in New Jersey, and serves clients across the country.