Fiscal Prudence
“Common Sense is Not so Common” – Voltaire
Investors started 2013 visibly exuberant with US politicians’ last minute crafting of a tax compromise a day after the U.S. technically went over the “Fiscal Cliff”. Equity markets reversed their late December weakness and rallied hard. After the S&P 500 lost 2% in the second half of December 2012, it rose 2.5% on January 2, 2013 to 1462. Characteristically, Congress claimed “victory” in “reducing” taxes (after they let them rise). You just can’t make this stuff up. Negotiations now turn to the unfinished business of expense reductions and expanding the debt ceiling a couple of months from now.
Impressively, in an environment of slowing global economic growth, stubbornly high U.S. unemployment, and a European recession, stock markets fared well in 2012: the S&P 500 rose 16% (with dividends), and most global stock markets rose 10% or more. The notable exceptions were Spain and Japan, down in U.S. Dollar terms for the year.
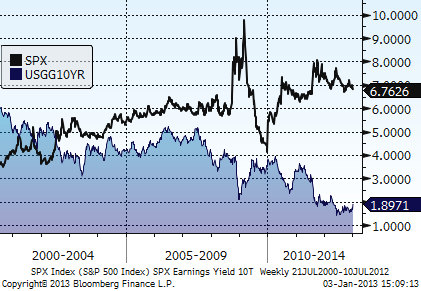
Bonds rallied again – the U.S. 10 year note’s yield dropped to 1.75% from 2.0%, at year-end 2012 and 2011, respectively. All major global benchmark 10 year notes shed yield in 2012 save Spain’s – it rose 21 basis points to 5.20% – but well off its high. 2012’s stock market volatility, as measured by the VIX, was relatively muted YOY averaging 18% vs. the prior two years’ 23%. Stock market valuations continue to appear reasonable with current P/Es (Price/Earnings) at 14.2 times (x) 2012 estimated earnings and just over 12×1 [1] 2013’s forward estimates. Dividend yields of 2.2% easily surpass the 1.9% yield of the ten year U.S. Treasury note (both as of 1/3/2013). Higher dividend yields are available in foreign stocks (3-5%) but visibility in earnings is inferior. The “FED Model” that compares the stock market’s yield (what we would earn on the S&P 500 if all firms therein paid all of their earnings in dividends) with the ten year Treasury bond shows one argument as to why stocks are attractive vs. bonds.
[1] The 1/2/2013 2.5% rally altered the S&P 500 Price/Earnings multiples to 14.9x and 14.1x estimated 2012 and 2013 earnings, respectively.
Figure 1: S&P 500 Index Earnings/Price and the U.S. Ten Year Bond Yield
We anticipate modestly higher economic growth in 2013. Bonds are unlikely to match 2012 returns given their low current yields. Rates will likely be higher a year from now, but not meaningfully unless employment growth rebounds. Stocks remain reasonably priced but it will require multiple expansion to deliver double digit stock market returns in 2013. Continued European uncertainties and weaker
global economies continue to point us to a US bias.
Taxes Bush-era tax cuts expired at year-end 2012 before Congress acted on the evening of January 1, 2013 to reinstate most tax rates, increase others, end some temporary tax accommodations and extend others.
Table 1: The American Tax Relief Act of 2012
TATRA (preliminary and subject to change) [2]
| Bush-era tax cuts expire |
2012 |
Approved 2013 |
| tax rates | 10%, 25%, 28%, 33% | Extended |
| Top ordinary income tax rate | 35.0% | 39.6% [3]$400k individuals,$450k filing jointly |
| Capital gains and Dividends tax rate | 0% < 25% tax bracket;15.0% for all others | 0% < 25% tax bracket; 15% for those earning <$400,$450k20% for those earning >$400,$450k |
| Payroll tax/employee | 4.2% on earnings up to $110,100 | 6.2%[4] earnings up to $113,700 |
| AMT (alternative minimum tax) | Lacked inflation adjustment | Permanent inflation adjustment |
| Estate & gift taxes | 35.0% | 40.0% |
| Estate & gift tax exempted | $5mm | $5mm [5] |
| Itemized deductions limitations | “Pease” limitations on itemized deductions were exempt 2010-‘12 | Those earning >$250-300k lose up to 80% of deductions |
[2] Source: RWM, Treasury Dept., WSJ 1/2/2013.
[3] Plus 3.8% on passive income above $250k
[4] Expiration of 2% payroll tax cut.
[5] indexed for inflation
The Tax Policy Center estimates that the average tax increases will be as follows:
Table 2: Estimated average tax increase (includes expiring payroll tax cut)
| Income level | Avg. Est. Tax Increase |
| $50,001-$75,000 | $822 |
| $100,001-$200,000 | $1,784 |
| $200,001-$500,000 | $2,711 |
| $500,001-$1,000,000 | $14,812 |
| More than $1 million | $170,341 |
While increased taxes imply lower disposable income that can dampen spending, the end to tax uncertainty bodes well for consumer and business confidence.
Regardless of what politicians call it, this marks the first substantive tax increase since 1993. It is critical that the next step of bi-partisan negotiations on entitlements, debt ceiling, and other expense cuts also be material, long term, and timely. Our country cannot afford to continue increasing government expenses: doing so would seriously hinder our country’s future global competitiveness.
Common sense may not be so common. Let’s hope that our political representatives in Washington, D.C. prudently apply some to our government’s fiscal situation in 2013 without undo melodrama.
Thank you for allowing us to share our uncommon common sense with you. We appreciate your partnership, trust, and business. Happy New Year!
Andrew M. Aran, CFA
Mark D. Reitsma, CFP®, CMFC
Timothy G. Parker, CFA
Click to Download a PDF of this newsletter
Regency Wealth Management is a SEC Registered Investment Advisor managing over $500 million for families and small institutional investors. Regency was founded in 2004, is headquartered in New Jersey, and serves clients across the country.

