Vol is Back
“It takes twenty years to make an overnight success.”
– Eddie Cantor
Volatility returned like a bear waking up after hibernation. While bears do not technically sleep all winter (though at times they are in a state of deep sleep or torpor), they do slow their breathing and heart rate as they adapt to their surroundings (escaping the cold and lack of food). Market volatility is similar as it is always present but sometimes dormant. It certainly “woke up” in dramatic fashion in early February after numerous months of slumber.
2018 opened with a bull rush; the S&P 500 Index rose 5.6% in January following the enactment of tax reform[1] in late December. All of those gains were erased in early February as fears of higher interest rates led to a steep, 10% sell-off. The “correction” (a 10% or more decline in prices) in U.S. stocks was the first such pullback since 2015 and included an impressionable one-day five percent drop. This dramatic action seemed to reflect some leveraged unwinding by speculative investors who were forced to sell as volatility spiked up. Markets consolidated and recovered 50% of their losses by month-end (S&P 500 Index dropped 3.9% in February) as robust fourth quarter earnings were reported.
Trade Wars?
Investors then had to contend with worries of trade wars in the making. The Trump administration announced tariffs on aluminum and steel in early March. Subsequently, a number of allied trading partners were tagged as likely to be exempt from the steel and aluminum tariffs[2]. Sanctions announced on Chinese imports prompted lower stock prices on investor concerns over rising trade tensions. Putting the noise into context, the $50-60 billion of Chinese imports into the U.S. represents about 10% of such annual imports. China announced a muted retaliation that $3 billion in tariffs may be imposed on U.S. exports (less than 3% percent of annual U.S. exports to China). All told, these look like marginal moves that will likely prompt further negotiations but are unlikely to lead to any meaningful growth-constraining trade policies. However, the Trump administration should be careful not to be overly aggressive with China as their ultimate reaction could have negative long-term consequences. These fears contributed to a 2.7% drop in the S&P 500 Index in March and a 1.2% loss for the quarter ended 3/31/2018. Numerous overseas stock markets retrenched more than those in the U.S. with Canada, UK, Germany, Switzerland, and Australia dropping over 4% and just a few markets rising (Italy and Hong Kong) in the first quarter.
Bond yields, as measured by the U.S. ten-year bond, were also volatile rising 47 basis points to 2.92% from year-end 2017’s close before rallying to end March at 2.74%. The Bloomberg Barclays US Aggregate Bond Index, dropped 2% in the first two months of the year before rebounding in March to return -1.5% for the first quarter. It now yields 3.1% and has a duration (a measure of interest rate sensitivity) exceeding six years.
Oil prices firmed, closing at $64.9/bbl., up from $60.4/bbl. at 12/31/2017. Gold rose $10/oz since year-end 2017, closing March at $1,327/oz.
U.S. Stocks Earnings Estimates Jump
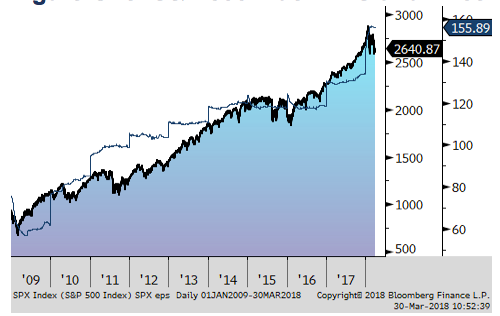
Consensus estimates for the S&P 500 Index’s earnings growth in 2018 from 2017 is 27%, boosted by lower U.S. corporate tax rates (from 35% to 21%). Earnings growth will vary by firm as increases in labor and capital investments will absorb some of the windfall. Dividend increases and stock buybacks are likely to increase as well. The more significant impact is economic as higher confidence may help drive a virtuous cycle of employment, wages, spending, and investments. While stock multiples (price/earnings) and earnings growth are not perfectly correlated, they naturally move in the same direction over time as shown in Figure One (blue shaded area shows the EPS estimate and the dark line is the S&P 500 Index). Possibly some of this earnings improvement was already anticipated by investors in late 2017 and January of 2018. Others may be skeptical of that rate.
Figure One: S&P 500 Index EPS and Price

Bond Pains and Gains
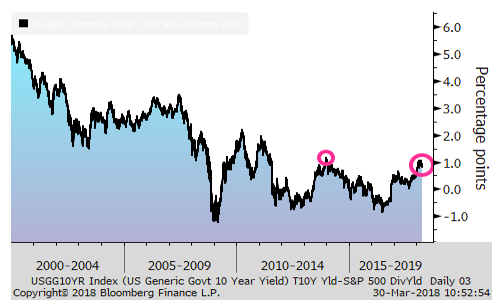
The relative competitiveness of bonds has increased moderately over the last year with the U.S. ten-year treasury now yielding about 0.9% more than the dividend yield of the S&P 500 Index as depicted in Figure Two. That said, the yield pick-up from bonds is not compelling to us in a rising rate environment. The bond market benchmark, the Bloomberg Barclays Aggregate index would lose about 2.5% if rates rise another 1% in 2018.
Figure Two: Cross-Asset Yield gap: Treasury 10-year yield vs. S&P 500 Index dividends

The Federal Reserve, as expected, increased the targeted discount rate by 0.25% to 1.5-1.75% in March and they anticipate raising it twice more this year and two to three times next year. Global bond investors are increasingly wary of how Central Banks will reduce accommodative policies
and excess liquidity without tipping their economies into the next recessions.
Economic Fundamentals Remain Constructive
The late 2017 environment of global synchronized growth seems to be in place. Final GDP growth for the U.S. was 2.9% in the fourth quarter. Consensus estimates for 2018 growth are 2.8%, 2.2%, and 1.3% for the US, Western Europe, and Japan, respectively [3].
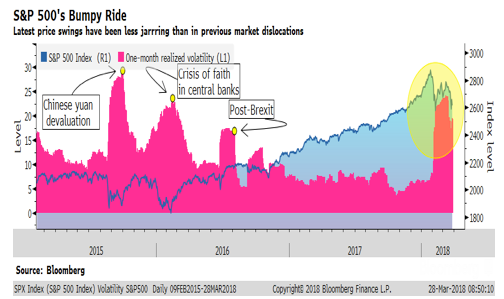
Figure Three: S&P 500 Index and Volatility

Volatility returned in 2018 as shown above. No one enjoys volatile markets but they are a necessary and unavoidable passenger in our long journey to pursuing and accomplishing our financial goals. The process is like a marathon and not a sprint.
Thank you for your continued trust in your Regency team. We are committed to working with you over the long term to help you reach your financial goals.
Please call us to share any thoughts, concerns, or insights!
Andrew M. Aran, CFA
Mark D. Reitsma, CFP®, CMFC
Timothy G. Parker, CFA
Bryan D. Kabot, CFP®, AAMS®
Click here to download a printable PDF
[1] Tax Cuts and Jobs Act, 12/22/2017
[2] Canada, Mexico, EU, Australia, Brazil are among those who may be exempt.
[3] Source: Bloomberg contributor composite 3/30/2018
Regency Wealth Management is a SEC Registered Investment Advisor managing over $500 million for families and small institutional investors. Regency was founded in 2004, is headquartered in New Jersey, and serves clients across the country.
