Power
A mid March weekend rain storm left over 200,000 people in Northern NJ without electric power. Four days later, most residents had regained power. The US stock market lost much “power” in the fall and winter of 2008-2009 but has recovered impressively from its lows over the last 13 months. The recovery in stock prices has coincided with a rebound in economic growth as measured by GDP. The charts below depict the rebounding US economy and equity market.
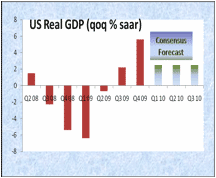
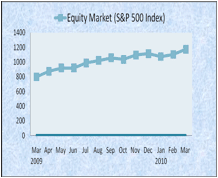
Prognosticators remain divided about its future direction (isn’t that always the case?). After all, unemployment remains high, government deficits are rising, real estate remains weak, stimulus must eventually be unwound, and while interest rates are low they are starting to rise. Will markets “lose power (value)” again?
History is a useful but not perfect guide to what to expect. What lies ahead will depend, not surprisingly, in how fast and sustainable the underlying economic recovery proves to be. The economy could be “spring-loaded” with capacity (under) utilization overstated. If so, and if the sharp corporate and consumer restraints undertaken in the dark days of the latest financial crisis begin to loosen, interest rates may have to rise quickly to curtail inflation.
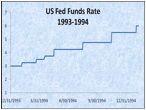
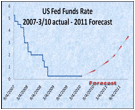
In 1994, a couple of years after the last real estate crisis, the Federal Reserve raised its Federal Funds Target Rate 7 times from 3% to 5.5% as the economy recovered. Concurrently, in early 1994, both stocks and bonds lost 8-9% within a 2-4 month period (February to May for bonds and February to March for stocks). Exhibit 2, below shows the progression of the Fed Funds Rate in 1994. At that time, the banks had re-capitalized and had again started to grow as the yield curve flattened and they grew loans to increase profitability.
Exhibit 2: US Federal Funds Rate progression and Regency Forecasts. Source: Bloomberg, LP
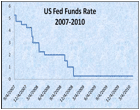
Currently, banks have little incentive in growing loans in a steep yield curve environment (the yield curve depicts market interest rates from overnight to thirty years) as they can borrow money at near zero rates and buy US Treasuries. As the economy improves and the yield curve flattens (as short term interest rates – largely set by the Federal Reserve – rise), banks have to lend to make money. A reinforcing cycle emerges as easier credit terms allow businesses and consumers to borrow to invest and spend and the economy grows further. The cycle lifts employment, investments, and spending. How quickly this cycle plays out after the deep recession and the convulsive markets of 2008-2009 remains to be seen. Our base case continues to be for steady though uninspiring US economic growth with higher interest rates by year end 2010. Consistent with this view, we have reduced bond duration (the price sensitivity to interest rates) in managed accounts and are maintaining highly diversified allocations to stocks and bonds. We hope this recovery maintains “full power”.
Thank you for your continued trust in Regency Wealth Management.
Mark D. Reitsma, CFP®, CMFC Andrew M. Aran, CFA
GDP equals the total income of everyone in the economy or the total expenditure on the economy’s goods and services. GDP includes only the value of final goods and services. Chain weighted (Real) GDP measures the value of goods and services at constant dollar prices. The base year changes continuously over time. For example, 1995 prices measure real growth from 1995-1996. The figures are then linked to form a ‘chain’ that can compare goods and services in any two years. Chain weighted figures never let prices get too far out of date. The GDP data is released with an Advanced Release, then a Second Release, followed by the Third Release. Source: Bloomberg LP.
Regency Wealth Management is a SEC Registered Investment Advisor managing over $500 million for families and small institutional investors. Regency was founded in 2004, is headquartered in New Jersey, and serves clients across the country.
